
Refined Markets East of Rockies May See Volatility Extend
Volatility was the name of the game for east of the Rockies gasoline and distillate spot markets in 2022, with the war in Ukraine creating upheaval in Europe and shifting international product movements.
With stubborn global inflation, the increased likelihood of a U.S. recession this year and continued conflict between Russia and Ukraine, this year’s uncertainty will hang over the marketplace into 2023.
For much of 2022, gasoline and distillates contended with steep backwardation — in both futures and physical markets — with prices dropping off quickly over time. The backwardation widened in the wake of the Ukraine invasion, as refined product exports rose.
But that pricing structure changed quickly in December, as RBOB prices moved toward a contango structure, with front-month RBOB futures valued below the next-month futures contract. The backwardation in ULSD futures narrowed to roughly 3cts between front-month and next-month contracts in early December.
With east of the Rockies production levels high and inventories remaining low along the East Coast (PADD 1), domestic and international product flows are likely to continue to play a sizable role in the year to come.
A Volatile 2022
One of the overarching themes for east of the Rockies refined spot markets in 2022 has been unmatched volatility, with prices seeing larger-than-normal daily swings.
Following the invasion of Ukraine in February 2022, markets saw a shift in structure as backwardation widened, with prompt barrels valued at a sizable premium to future barrels. That incentivized market participants to sell their material rather than hold onto it and discouraged storage.
And the resulting tight inventories appeared to cause pockets of low supply and huge price swings within each region.
With such volatility, some traders — particularly those who don’t produce refined products — were hesitant to trade, according to market participants.
 In 2022, outright price movement per day more than doubled from what was seen over the last five years, as prices shot sharply higher for a second straight year.
By early December, for example, CBOB spot prices in the major east of the Rockies spot markets had seen average daily price moves of plus or minus 7.88cts/gal in 2022, far outpacing the 2.50ct-3.50ct daily moves experienced in 2018 and 2019.
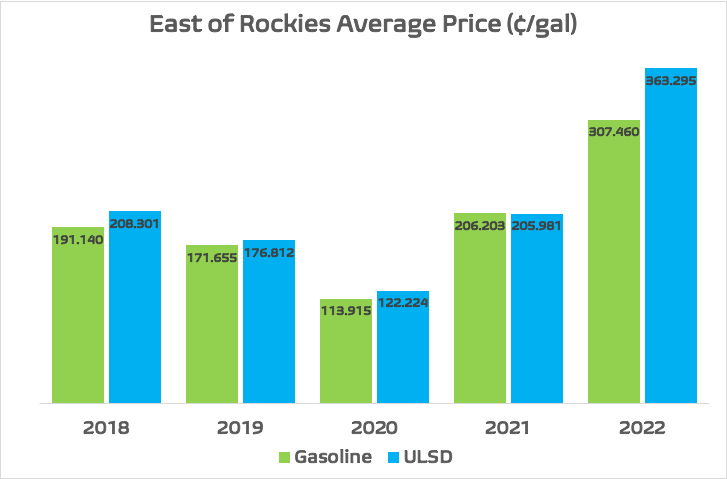
And those swings came in a market where outright prices were well above those of the last five years. CBOB on average across the major east of the Rockies markets was pricing at $3.0746/gal in 2022, as of early December — more than a dollar above the $2.06/gal average seen in 2021 and 2020’s $1.13915/gal average.
Even the more “normal” pre-Covid-19 years of 2019 ($1.71655/gal) and 2018 ($1.9114/gal) saw yearly average CBOB prices well below those of 2022.
Daily price movements in diesel spot markets saw even more volatility than gasoline markets in 2022. ULSD for major east of the Rockies markets moved an average of plus or minus 10.14cts/day — more than triple the 2-3ct average daily move seen from 2018-2020.
And like CBOB, ULSD spot prices were much more expensive — averaging $3.63295/gal in 2022 as of early December, significantly above the 2021 average of $2.05981/gal, the 2020 average of $1.22224/gal, 2019’s $1.76812/gal average and 2018’s $2.0830/gal.
Distillate Prices Spike With Tight Inventories
Low inventories were a key factor in the spike in ULSD prices, most notably in the U.S. Northeast, and while backwardation eased and stockpiles grew somewhat in the closing weeks of 2022, East Coast (PADD 1) distillate supplies remained well below the five-year average, with more cold weather months still to come in a region that relies heavily on heating oil, possibly further pressuring already low supplies.
With New York Harbor the delivery point for NYMEX ULSD futures contracts, these tight supplies affected futures and physical prices throughout the year.
Spring and fall 2022 saw peaks in ULSD futures backwardation. Front-month futures on April 28 were more than $1.12/gal above next-month contract. In the fall, backwardation widened out again, and on Oct. 28 front-month futures were priced more than 80cts/gal higher than next-month futures.
Physical ULSD prices in the Northeast were also steeply backwardated, as barrels that might have headed to the region were shipped to Europe and other locations. In the spring, ULSD spot differentials climbed as high as $1.40/gal above front-month futures, before pulling back for much of the summer. The differentials shifted higher again in October, peaking at $1/gal above ULSD futures in early-to-mid November.
Following the loss of capacity in the region after the closure of the Philadelphia Energy Solutions refining complex in mid-2019, the East Coast has needed to rely more on refined products from other regions, domestically and internationally.
But in the four weeks leading up to the spike seen in the spring, PADD 1 distillate imports averaged just 85,000 b/d — well under the more than 100,000 b/d seen at the same time over the previous three years, according to Energy Information Administration data. Likewise, October saw an average of 82,300 b/d of PADD 1 distillate imports, while the similar same period of 2020 and 2021 saw imports averaging more than 200,000 b/d.
Both spring and fall peaks happened amid historically low inventory levels of distillate in the Central Atlantic region (PADD 1B), according to EIA. The week ended May 20 saw PADD 1B stocks fall to roughly 8.5 million bbl, the lowest level since at least November 1990, when EIA began breaking out sub-PADD data. By the fall, those supplies fell again, bottoming at about 10.8 million bbl.
That dynamic, however, quickly shifted and by early December, the backwardation between front-month and next-month ULSD futures narrowed to less than 3cts. Cash differentials for physical product in the New York Harbor flipped from those hefty premiums to a discount of a few pennies versus front-month ULSD futures. As of the week ended Dec. 2, EIA data showed distillate stockpiles in PADD 1B had rebuilt to about 13.5 million bbl, while still well below the 23.1 million bbl level seen one year prior.
A decrease in U.S. distillate exports, increased imports and higher production rates may have been factors behind that build. U.S. distillate exports retreated from 1.446 million b/d in the week ended Nov. 4 to 1.274 million b/d in the week ended Dec. 2.
A recent increase in shipping rates is another factor behind the lower exports, according to a market participant. And with lower exports, more product is left to be shipped by pipeline to the Northeast and Midwest, potentially easing supply in those markets.
And that may well continue in 2023. “My guess is we still need to supplement supply through heavy demand periods, with Gulf Coast [barrels], and [we] will be competing with exports moving forward,” a Midwest market participant said of 2023.
The other side of the equation has been distillate imports, and in the week ended Dec. 2, imports to the U.S. reached 372,000 b/d, with 338,000 b/d of that headed to the U.S. East Coast, the highest levels since the week ended Feb. 25, when Russia invaded Ukraine.
Weaker domestic distillate demand also appeared to be a factor, at roughly 3.55 million b/d, though that is on par with seasonal expectations. Concerns regarding distillate demand may remain in focus in 2023, given that many economists are expecting the U.S. will enter a recession this year.
In the Midwest, however, distillate demand in the coming year will also depend upon agricultural production, with one market participant predicting “demand will remain firm with good commodity prices set to continue as farmers look toward maximizing yields and production throughout the Upper Midwest into the next growing season.”
“Dry weather may look to persist, which should continue to drive demand for irrigation, but may also limit production if we don’t have a change in the recent weather pattern,” he added.
“I feel like the story of the front end of 2023 is going to be diesel fuel,” a source said. “Between a crazy export market and a woefully supplied heating oil market, diesel could get ugly.”
Product Flows
As seen with distillates, product flows were a key element of the east of the Rockies market in 2022, and that will likely continue in 2023.
In 2022, exports increased out the U.S. Gulf Coast and that left less material available for transport up Colonial Pipeline to the East Coast and other domestic destinations.
“Exports are going to dictate how things go,” one trader told OPIS. “If there is a global recession, Latin America will stop buying so much distillate. [It] should change the landscape and give PADD 1 a reason to fill up.”
Distillate exports leaving the U.S. Gulf Coast region in the first nine months of 2022 topped 321.284 million bbl, according to EIA data. Distillate products leaving the U.S. Gulf Coast reached a 2022 high of 43.395 million bbl in July, the highest level in five years. That was a more than 66% increase over February 2022, when 26.007 million bbl were exported.
Mexico ranked as the largest destination for distillates, pulling in the largest volume of distillate fuel oil from the U.S. Gulf Coast in April 2022, with more than 11.1 million bbl, an all-time high for exports destined to Mexico dating back to 2010 when EIA began tracking data. South American countries saw the second-largest intake of distillates from the region.
As for European destinations, the U.K. accepted the largest volume of U.S. Gulf Coast distillate exports at 7.141 million bbl over the first nine months of the year. The Netherlands was the second most popular European country with U.S. Gulf Coast distillate exports at 6.434 million bbl over the same period.
U.S. Gulf Coast gasoline exports reached a record high in September, with 30.087 million bbl of finished product shipped out of the country. EIA data had that as the highest mark reached since the agency began tracking the numbers in 1981.
As was the case with distillates, most gasoline was sent south of the border. Gasoline products leaving the U.S. Gulf Coast for Mexico hit a 2022 peak in May at 17.668 million bbl, the highest level since December 2021. No other country came close to Mexico’s numbers, with Colombia the only country to see imports from the U.S. Gulf Coast climb above 10 million bbl.
Rising Gulf Coast Gasoline Production With Uncertain Demand
U.S. Gulf Coast refiners entered 2023 with some of the highest run rates in the last several years. EIA put capacity utilization in late November 2022 at more than 98%, a level achieved only seven times since the government began tracking the data at the start of 2010.
The high run rates will lead to more gasoline hitting the market at a time when demand is falling. U.S. gasoline demand in 2022 only breached 9 million b/d a handful of times, according to EIA, well under the 9.5-million-b/d-plus seen during much of the summer months in pre-Covid years.
With the domestic economy all but certain to continue to face high inflation and possible recession this year, a number of companies have already begun to cut staff over the last several months and many market watchers believe this will continue into 2023, further depressing gasoline demand.
With less demand, refiners in the U.S. Gulf Coast, which account for more than half of all U.S. production, will look for alternative markets for fuel that they are producing at or near record rates. That could open gasoline export lanes to other areas of the U.S. that don’t have as much refining capacity (like the Northeast and Group 3) and to international markets, particularly Mexico and Latin America.
–OPIS staff report; Editing by Jeff Barber, jbarber@opisnet.com, and Michael Kelly, mkelly@opisnet.com
Stay on top of changes to world crude runs and downstream conversion capacity that may significantly impact returns for both new and existing refineries with OPIS Intraday News Alerts.
- Be the first to know about mergers, acquisitions and bankruptcies.
- Identify arbitrage opportunities with import/export insight.
- Put supply and demand news into context.