17 Game Changing Northeast Natural Gas Pipeline Projects
As summer 2017 wound down, the U.S. Northeast experienced record natural gas production output and depressed consumption.
This set the stage for recently expanded pipeline routes to make their mark on the Lower 48 market.
Outflows from the Northeast are set to play a major role in balancing the current market, but over the next 18 months pipeline capacity growth is likely to outpace the ability of new production to fill it.
This post explores 17 market-altering Northeast natural gas pipeline projects that could change basis relationships and behavior and topple the trends of the past five-plus years.
But first…
What a Difference a Year Makes
In summer 2016, Northeast natural gas consumption levels, including fuel and pipe loss, averaged 15.7 billion cubic feet per day (Bcf/d) while regional gas production levels stood near 21.8 Bcf/d.
Net outflows of natural gas to neighboring regions averaged near 4.7 Bcf/d, leaving roughly 1.4 Bcf/d of gas available to go into storage.
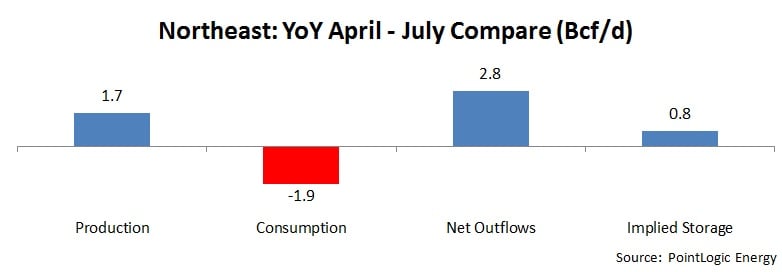
Over the same April-to-July period in 2017, Northeast production increased by 1.7 Bcf/d, or 8% to average 23.5 Bcf/d.
Meanwhile, Northeast gas consumption levels declined by 1.9 Bcf/d, due to a relatively cool summer and higher year-on-year natural gas prices that gave coal-fired power generation a boost.
- For more on summer 2017 power demand, click here.
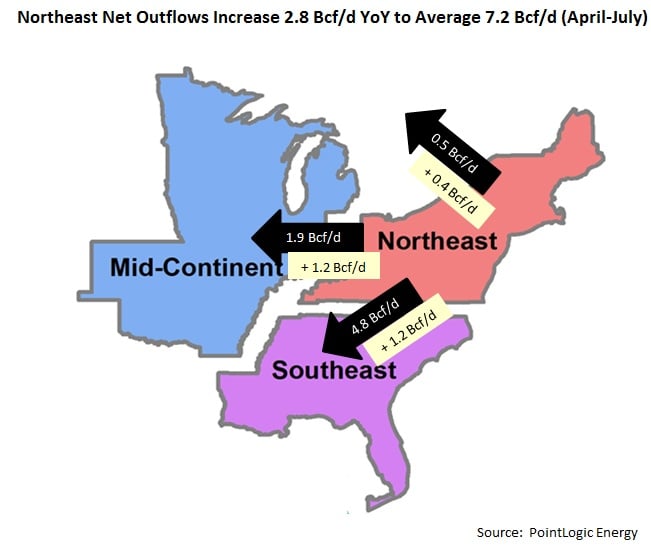
The equalizer in this equation has been the surge in gas flows leaving the Northeast April-July 2017, up by 2.8 Bcf/d, or 60% to average 7.2 Bcf/d.
All of this culminated into an implied increase in summer storage injections of 0.8 Bcf/d.

Infrastructure Upgrades to the Rescue
The Northeast region’s gas flows are complex, with gas flowing west, east, south and north. This occurs both from a region-to-region perspective at an individual pipeline level and within the Northeast itself.
The summer of 2017 realized the impact of a slew of infrastructure upgrades to systems like:
- Rockies Express (REX) and Texas Gas Transmission (TGT), carrying supply to the Mid-Continent
- Transco, Tennessee Gas Pipeline (TGP), TETCO and Columbia Gulf Transmission (CGT), bringing gas to the Southeast
- TGP, Empire Pipeline and (on occasion) Maritimes and Northeast Pipeline, exporting gas into Canada
This map depicts the regional flow of the first four months of summer 2017 (black arrows) and the change from the same period last summer.

What’s Next for These Regions?
Northeast production through 2018 is set to increase by 6.0 Bcf/d with only a marginal amount of demand growth.
Meanwhile, PointLogic is tracking over 12 Bcf/d in pipeline projects through 2018 that have the ability to increase gas outflows from the Appalachia.
Flows to the Mid-Continent
In August, TETCO put into service the 102 MMcf/d Lebanon Extension Project three months earlier than originally proposed. This project shares related facilities with two other TETCO projects that will target the Southeast come November.
Regulatory pressure intensified for the Rover Pipeline, slowing and in some cases halting construction. The latest update from Energy Transfer Partners, the developer of Rover, is that Phase I will be delayed to sometime in “late summer’’ instead of July, as was the prior estimate. Phase II is still on track for November 2017.
Likewise, the 1.5 Bcf/d Nexus Pipeline project, which is awaiting FERC approval, recently announced it would be delayed until 2018. PointLogic estimates it could be online during 2Q 2018 based on construction timelines and when FERC may have a quorum status to approve the project.
Together, these three upcoming westbound projects from the Northeast combine for 4.85 Bcf/d in potential outflow capacity from the Marcellus and Utica.
This is a huge shift in available capacity and, per a PointLogic analysis, unlikely to be highly utilized in its first handful of months. Instead, production growth will be more gradual as 2018 progresses, filling up available capacity at a slower pace, contrary to how pipeline projects leaving the Northeast have behaved in years past.

Flows to the Southeast
There are flurry of projects coming that will expand Northeast gas flows to the Southeast.
Transco’s Dalton Expansion project saw a partial early in-service earlier this summer, reaching full service in August.
Meanwhile, October 2016, TETCO put into service Phase I of its Gulf Markets Expansion project in October 2016, boosting southbound capacity by 0.1 Bcf/d. In August 2017, Phase II was slated to add another 0.4 Bcf/d of southbound potential.
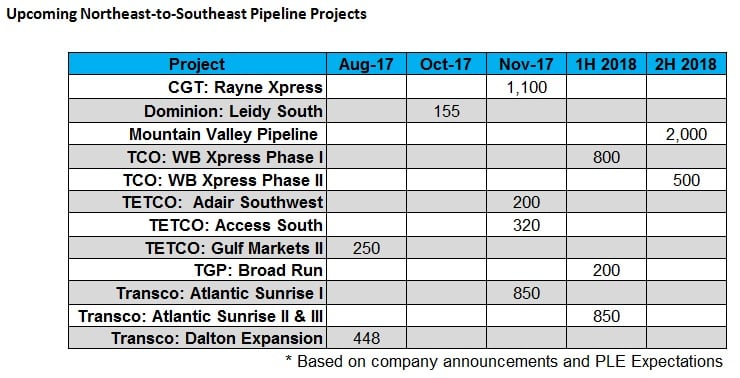
As the chart below highlights, come November, southbound capacity will gain 2.5 Bcf/d and create a large opening for Northeast production to grow – if downstream demand within the Southeast materializes in-kind.
Then, during 2018, another monumental shift will occur, with over 4.3 Bcf/d slated for in-service. Each of these projects is contracted by a combination of producers, gas distribution companies and, in a few instances, shippers with LNG export intentions.

Flows to Canada
The 133 MMcf/d Atlantic Bridge project along Enbridge’s Algonquin Gas Transmission and Maritimes & Northeast Pipeline is slated for a June 2018 in-service.
What This All Means to the Northeast
PointLogic forecasts Northeast production to surpass 30.0 Bcf/d by late 2018, a build of roughly 6.0 Bcf/d from current levels.
Meanwhile, takeaway projects from Appalachia will add over 12.0 Bcf/d in pipeline capacity that pushes gas west and south.
While a large portion of that buildout is anchored by producers, it is dependent on a demand-pull reality. Without corresponding demand growth across all sectors, it would not be realistic for 6.0 Bcf/d in Northeast production growth to indirectly displace production in other areas within the next 18 months.
That said, by year-end 2018, there is still likely to be excess takeaway capacity from the Northeast, and it could persist for a period of time. Producers own a little more than half of the 12.0 Bcf/d in Appalachia takeaway project growth through 2018.
As a result, basis relationships and transportation spreads may experience more volatility, given that the behavior and incentives are evolving as transport capacity optimization strategies change.
