
Fuel Prices and COVID-19: OPIS Blog Toolkit
Fuel prices in 2020 have been rocked by COVID-19 and an oil price war.
Throughout this unprecedented time, this blog space has offered insights and perspectives to help fuel buyers and sellers navigate their way through this unprecedented season. Here’s a collection of five blog posts to help you steer your way through the choppy waters.
Read on or jump to each post:
COVID-19 Coronavirus: Bleak Math for Refiners
How Will NGL Markets Adapt to the Oil Price War & COVID-19?
Q1 2020 Review: An Unprecedented Quarter for Gasoline Retailers
Airline Industry Faces Long Recovery; Cheaper Jet Fuel Costs Offer Some Relief
Ethanol’s Unique COVID-19 Price Story
COVID-19 Coronavirus: Bleak Math for Refiners
Mar 20, 2020
The outlook for U.S. refining operations is grim amid the downturn for futures and wholesale gasoline and diesel prices.
Demand is plummeting for transportation fuels as a result of sweeping economic impacts stemming from the coronavirus, forcing producers to look at some hard math.
Watch this to understand some basics refinery economics amid COVID-19 then read below for updates:
There are two choices for refining companies looking ahead:
If management believes that COVID-19 will peak and wane within, say, six to eight weeks, the answer may come via a cut in utilization to 70% or less across the 132 operating refineries in the U.S.
If, however, a more prolonged period of demand destruction looms, executives will identify candidates for closure.
Less complex inland sweet crude refiners might be the most vulnerable, since they don’t have access to lucrative export markets.
“The question isn’t how much turnaround activity do we see this year. The question is at the end of all this, which refining companies survive?” one longtime refining executive told OPIS.
How Will NGL Markets Adapt to the Oil Price War & COVID-19?
Mar 30, 2020
The coronavirus disease 2019 (COVID-19) has significantly impacted the mainland Chinese energy markets, and the spread of the virus to pandemic proportions is affecting energy markets across the world.
Demand destruction from COVID-19 disrupted mainland China’s energy system, and the virus is now propagating through and to energy markets globally, lowering energy demand in its wake.
To add insult to injury, a global oil price war erupted and has raised the situation to extraordinary proportions. Oil prices have plummeted, tearing down the historical price relationships in the energy and chemical markets, including NGLs.
The NGL Market Backdrop
- The United States and the Middle East are being pulled into the wake of the oil price war given their LPG supply positions.
- These two alone are the primary LPG supply sources and dominate the global LPG market on an absolute and incremental volumetric basis, thus making LPG supply highly sensitive to oil market events.
- These sources of LPG supplies are not created “equal” and incremental oil production from the Middle East and by-product LPG production is not equal to decremental production from the United States.
- Declines in US oil production would correspondingly result in lower associated natural gas production.
- Barring any US natural gas end-use market demand losses, the associated natural gas production loss would exert upward pressure on the Henry Hub price.
- Residential and commercial demand has and will fall with the spread of COVID-19; chemical demand, which is the most price-sensitive tranche of LPG demand, is likely to fall with lower crude oil prices from the oil price war, leading to significant LPG production declines.
- NGL prices are influenced by many other non-oil factors including but not limited to natural gas, naphtha, basic chemicals (including ethylene and propylene) balances and prices, and waterborne freight rates.
- The oil price war shock does not affect all NGL (ethane, propane, butane, natural gasoline) prices to the same degree
Key NGL Market Question and Views
How should we expect the NGL prices — by-products of upstream oil and gas development and refining operations— to adapt and react?
- The plummet in oil prices served as a shock to the system, causing ripple effects across the value chain that have various implications on NGL price setting.
- US ethane follows the trajectory of “local US” natural gas prices as a floor and ethylene production cash cost parity values for US propane and normal butane as a ceiling.
- In Asia and Europe feedstock switching between LPG and naphtha compete on an ethylene production cash cost basis with a with waterborne freight being the possible tipping point for selecting waterborne LPG versus local naphtha.
- Higher natural gas prices would help support higher ethane prices.
- In terms of LPG prices, lower oil prices have pushed Asian LPG prices down sharply, narrowing the price arbitrage between Asia and Mont Belvieu.
- At the same time, even though VLGC rates have slowly retreated from the 2019 high levels, they remain relatively high at about $90 per metric ton today.
- Therefore, US LPG prices are depressed, on a netback basis, incentivizing LPG cracking and consumption of LPG for chemical manufacturing.
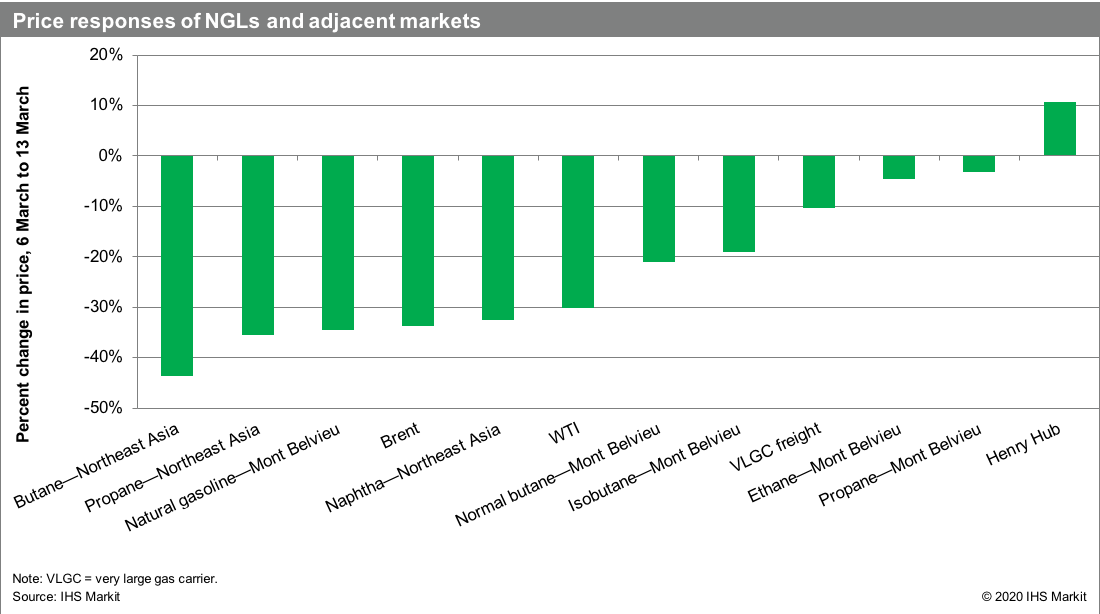
- Figure 1 below shows the percentage changes in prices for the key NGLs and adjacent markets during the week following oil price war events, 6 March through 13 March.
- As of this writing, current LPG ethylene production cash costs (about 7.4 cents per pound for propane and 6.8 cents per pound for butane) are below that of ethane, at about 8.5 cents per pound.
Written by Darryl Rogers, Vice President, IHS Markit and Yanyu He, Ph.D, Executive Director, Asia Pacific/Middle East NGL Service, IHS Markit
The first quarter of 2020 brought unprecedented challenges to the downstream petroleum industry, as coronavirus disease 2019 (COVID-19) began to take its toll. How did gasoline retailers fare?
Navigating the Historic Demand Shock
It was not until mid- to late February that demand issues started to hit the United States, but the exponential growth in demand destruction coincided with schools closing, state governments issuing stay-at-home orders and requiring non-essential businesses to close their offices.
Due to the most significant demand destruction not taking place until late in the quarter, full quarter numbers may not look as terrifying as originally thought.
Download OPIS full Q1 report, with charts that enhance this analysis.
On average, same-store sales volumes during the first quarter were off by 8.2%, according to data from OPIS DemandPro.
According to volume data from about 15,000 stations around the nation, OPIS estimates that gasoline demand has gone from about 7.8 million b/d in the beginning of the year to less than 4.9 million b/d by the end of the quarter. During a few weeks in late February and early March, gasoline demand ran just shy of 8.8 million b/d, perceived to be consumers stocking up before stay-at-home orders went into effect.
Stay-at-home orders were first issued in the coastal regions of the Pacific Northwest and Northern California, with states in the Northeast issuing stay-at-home orders around the same time. As a result, these regions saw the largest quarterly demand declines, as Northeast volumes fell by 9.3% and the West (which includes the Rockies) was off a substantial 10.1%.
OPIS notes that the inclusion of the Rockies in the West data may have kept the quarterly volume figures from sliding even more.
The other regions that OPIS DemandPro tracks (the Southeast, the Southwest and the Midcontinent) did not necessarily see the same demand destruction, as quarterly volume losses ranged from 7.2% to 7.4% during the quarter. These regions are catching up to the Northeast and West, however, as weekly reports in late March indicated demand destruction in the 40%-50% area.
As a result, OPIS estimates that the average monthly volume at U.S. retail outlets stood at 78,860 gal. That compares with nearly 86,000 gal in the first quarter of last year. The West saw the largest average-gallon loss, going from well over 110,000 gallons to barely 101,000 gal per month.
The second quarter is already off to a rough start. Anecdotally, depending on the region, sources are reporting volumes off as much as 75%. The wider year-on-year losses, though, for early to mid-April are calculated against a time when demand is typically on the rise.
Off-the-Chart Retail Fuel Margins Offer a Silver Lining
The swift moves in oil prices have left rack-to-retail margins in record territory. However, with fewer motorists on the road and fill-ups, convenience stores are losing potential inside sales.
During the first quarter, the average U.S. margin stood at 39.2cts/gal, with the highest margins coming at the tail end of the quarter. Margins had been performing relatively well even before the price war and demand shock sent crude oil and refined product prices spiraling lower.
The first quarter of the year can always be challenging for margins. The 2019 Q1 average was considered solid, but this year saw margins nearly double in the first quarter of 2020.
Early-year geopolitical tensions sent crude prices to an early high. A quick price retracement left margins on solid footing. According to data from OPIS MarginPro, only one week in 2020 so far saw the average margin trail last year and that was the first week of the year, when the average margin of 25.7cts/gal was less than a penny below a year ago.
Since then margins have blown out on a weekly basis, with the average margin ending the first quarter at about 87cts/gal. It was not uncommon to see several markets with margins greater than $1/gal on deep discounts at the rack and slow-moving retail prices.
Desperation sales at the rack level have seen several markets, where OPIS has captured sales of finished E-10 gasoline at less than 30cts/gal in recent days. Additionally, parcels of gasoline at the rack have been selling at discounts of 15-20cts to the OPIS low rack price on occasion.
That has also kept average rack-to-retail margins on strong footing, even as retail prices come down and now average less than $2/gal in the U.S.
The largest cents/gallon margin moves in the first quarter were in the Northeast, where the average margin grew to 46cts/gal — up 21.5cts/gal. The West had the highest outright margin at 57.8cts/gal — up a little more than 17cts/gal versus a year ago.
The Southeast, the Southwest and the Midcontinent, while posting smaller outright margin averages, have seen spectacular growth versus that of last year. The Midcontinent saw the smallest-percentage gain versus last year: an eye-popping 99%. The Southeast and the Southwest saw quarterly average margins grow 133% and 140%, respectively. Although all three regions saw massive increases in margins, the averages were in the 31-34cts/gal area.
With the record-breaking margins came strong station profitability, as the stronger margins offset lost sales volumes of fuel. However, the potential inside sales lost at most chains more than likely took a chunk of store profits.
OPIS estimates that the average monthly profit on gasoline in the first quarter was $30,913. That represents a nearly 75% increase from the first three months of 2019.
Like gross rack-to-retail margins, the Southeast, the Southwest and the Midcontinent saw monthly profits almost double from those of last year, while the West saw profits up nearly 30%, to close to $60,000. In the Northeast, estimated profits were up more than $15,000, to $37,594.
According to OPIS data, estimated profits were strongest during the week of March 21 at just shy of $12,000.
Airlines are staring down a long road back in the wake of a veritable cliff dive in travel demand, which has led to an equally steep drop in the cost of jet fuel.
First, an encouraging perspective amid the bleak picture for airlines: One of the bright spots emerging from the coronavirus disease 2019 (COVID-19) pandemic is the tremendous work people are doing across multiple industries to help one another.
Few industries have been hit as hard as the airline sector, but airlines, while dealing with the crisis, are also providing a vital service, delivering critical medical personnel and products where they are needed to save lives.
The list of airlines doing their part is impressive: United, American, Delta, Hawaiian, UPS, FedEx, Alaska, Atlas and others. Most of the airlines have increased their cargo capacity to help fulfill medical supply needs, even as they have gutted passenger flight schedules from COVID-19.
Still, the great work the airlines are doing can’t alleviate the financial pain they are experiencing because of lost revenue.
The Immediate Forecast Looks Dark for Airlines Amid COVID-19
Australia’s second largest airline, Virgin Australia, is seeking bankruptcy protection, published reports indicate – one of the first big airlines to do so.
The International Air Transport Association has estimated airlines may burn through more than $61 billion of their cash reserves during the second quarter, while posting quarterly net loss of nearly $40 billion.
Some of IATA’s assessments are based on a scenario where severe travel restrictions remain in place for three months – through June 2020.
Many airlines have already tapped into their maximum available credit lines to meet daily operational expenses, with some admitting there are coughing up $50 to $100 million in daily losses.
Airline executives have taken pay cuts or are going without pay for an extended period, while airline employees have volunteered to take unpaid leaves from work to aid in reducing costs.
Alexandre de Juniac, IATA’s director general and CEO, has said that airlines aren’t able to pare costs fast enough to stay ahead of the impact of the crisis, made worse by the liability for potential ticket refunds.
And no one can predict when passengers will return in force to the air given all the uncertainties that continue to surround the spread and the control of the coronavirus.
Decline in Aviation Fuel Prices Provides Some Cost-Saving Relief
The decline in jet fuel prices has provided some relief to the extent that airlines are still using fuel. And though they are strapped for cash and may not be positioned to hedge fuel costs, the steep plunge in fuel prices offers a tempting target to try to lock in future fuel savings.
Airline fuel buyers would be advised to pay close attention to forward spot jet fuel prices, thanks to the historic OPEC+ meeting that was a first step in clearing up the staggering fuel surpluses impacting near-term oil prices.
The alliance agreed to trim some 10 million b/d of crude oil production. The expected cuts, which are for May and June, when paired with shut-ins in the coming months from the U.S., Canada, and other non-OPEC producers could remove some 14 million b/d of crude from the market in the next two months.
Roger Diwan, vice president financial services, IHS Markit, said this is critically needed relief in the face of declines in global crude demand estimated around 20 million b/d.
When Will Jet Fuel Demand Kick Back In?
Of all the major products, jet fuel demand has been hit the hardest and may very well be the slowest to recover.
Still not known is when global oil demand for jet fuel, gasoline and diesel fuel will rebound to help clear up surpluses of finished products that have mounted.
The price of crude oil in a historic transformation turned negative and May refined product prices continue to see downward price pressure.
Each week the oil supply/demand data released by the U.S. Energy Information Administration (EIA) documents the progressive loss in U.S. jet fuel consumption. Deliveries have dropped to 463,000 b/d through the start of April, the lowest single-week delivery rate in the four decades of OPIS pricing history. That number compares to pre-COVID demand rates that in 2019 and early 2020 easily topped 1.8 million b/d and often surpassed 2 million b/d.
On a percentage basis, jet fuel deliveries for March were down more than 40%, EIA data shows, which is 8% greater than the decline in motor gasoline consumption. The percentages are likely to get greater in the coming weeks.
IHS Markit forecast modeling for jet fuel consumption through 2021 points to jet fuel usage rates, relative to 2019 levels, to be slower into 2020’s fourth quarter. They don’t match any of the 2019 robust levels until July 2021. Even then the highest number on a monthly basis is just over 1.72 million b/d for U.S. consumption.
Murky Path for Jet Fuel Environmental Initiatives
Also unknown is the impact all of this will have on airlines having to meet the highly anticipated Carbon Offsetting and Reduction Scheme (CORSIA), the decarbonization plan that was set to accelerate at a much faster pace starting in 2020 and proceeding over the next several years.
Regulated by the United Nations’ International Civil Aviation Organization (ICAO), CORSIA was designed to work under the principle of using carbon credits and sustainable aviation fuel to offset the growth in emissions using an average of 2019 and 2020 aviation emissions as a target baseline.
COVID-19 has all but wrecked the 2020 baseline numbers.
IHS Markit believes the entire CORSIA plan is under threat as cash-strapped airlines battle to rebuild their businesses and may not have the incremental cash to meet compliance.
Associate Director of Oil and Downstream Ronan Graham said in a recent note the “catastrophic decline in demand for air travel in 2020” will scale back the industry’s decarbonization drive as they “battle for survival.”
The post-2020 aviation industry will encompass a “smaller set of well-capitalized airlines, likely offering fewer routes at a higher cost” and “fear of contagion will persist” keeping demand below 2019 levels, Graham said.
Drastically fewer miles are being driven due to stay-at-home measures to combat COVID-19, resulting in a decline in gasoline prices per gallon you can see just driving past your local filling station. But what about the price for a key component of your gas: ethanol?
Ethanol makes up typically 10% of every gallon of gasoline a driver puts in his or her tank, due to mandates set forth in the Renewable Fuel Standard. It’s worth keeping an eye on ethanol spot and rack prices amid Q1 and Q2 2020 oil market price volatility – or really any time.
Simply put, ethanol prices have fallen dramatically alongside gasoline blendstock values this year. But let’s drill down into ethanol’s unique COVID-19 price story, so far.
Late 2019 Ethanol Production Trends Were a Glimmer of Hope Until Virus Hit
Long before the word “coronavirus” was uttered in discussions – related to fuel or otherwise – or global oil price wars came to a head, ethanol producers had a similar output problem as OPEC.
That is to say, they were churning out ethanol. A lot of ethanol.
Last year was a watershed year for ethanol production. Production rates soared to 1.096 million b/d in the week ended June 7, 2019, just under the all-time high of 1.108 hit in December 2017, according to the Energy Information Administration. Seven weeks later, U.S. ethanol stocks approached 24.5 million bbl, which was an all-time high before COVID-19 sent inventories spiraling to well over 27 million bbl.
Due to this bearish supply picture, a typical Iowa plant spent most of 2019 realizing an average margin less than 5cts/gal.
“We finally reach(ed) that point where we were really producing more than we could even blend domestically and more than we could possibly even export abroad,” OPIS ethanol editor Jordan Godwin said in a recent episode of the OPIS Crash Course podcast.
Listen to the whole podcast here:
In reaction, ethanol production rates slowed to a three-year low of 943,000 b/d in the week ended Sept. 20, 2019. For the first time since 2016, production rates held below 1 million b/d for five-straight weeks. The period was prolonged enough to help rebalance supplies, which hit a three-year low of 20.277 million bbl in the week ended Nov. 22.
Entering December, margins rebounded to 2019 highs – over 30cts/gal.
A glimmer of hope … just in time for coronavirus to land and devastate ethanol margins all over again. Margins tumbled deeply into negative territory, falling as low as 30cts/gal in the red in some cases.
“A lot of ethanol producers have had no choice but to slow rates, substantially idle their plants and even – in some cases – shut down entirely and lay off staff,” Godwin said. Production rates in mid-April were off by about 40%.
Now the Ethanol Supply Overhang Is Back – with a Vengeance
Because ethanol producers throttled back output in the latter portion of 2019, and margins staged a tidy recovery, suppliers turned the spigot back on at the start of 2020. In January and February, ethanol production rates neared nationwide capacity levels.
“And coronavirus really just became the final straw,” Godwin said on the Crash Course. “And since then, we’ve seen inventories push over 25 million, 26 million, even 27 million barrels for the first time ever. … What was already a pretty ugly situation in the ethanol industry and for supplies got a whole lot uglier.”
In March 2020 All-Time Ethanol Spot Price Lows Were Stuck on Repeat
As COVID-19 demand destruction began to take hold, Chicago gasoline blendstock was valued 43cts/gal below the price of gasoline futures on the NYMEX – a five-year low for discounts.
Ethanol market watchers can beat this historic comparison. In the last week of March, an all-time historical ethanol price low was recorded in every spot region OPIS assessed. And throughout the week, the all-time lows only got lower.
The Chicago ethanol market – essentially the U.S. hub at the center of the heartland, where most corn is grown and ethanol is produced – stood out especially for Godwin.
“We’ve been tracking that market for nearly 17 years, at OPIS,” he said. “And we got to a level where we were like 30cts below the previous low that was set way back in 2003. So definitely uncharted territory.”
Ethanol Blend Levels Matter at the Retail Pump
At the start of the COVID-19 crisis, U.S. gasoline retailers held onto a little hope.
That’s because the price they paid for gasoline at the wholesale rack followed the trends in the spot market – i.e., straight off a cliff, quickly.
The street price for gasoline often plays catch-up with prices at the spot and rack level – read more about that here. So, there was some profit to be made in the – albeit smaller – volumes moved at the pump.
In the middle of April, the U.S. wholesale gasoline price average was 59cts/gal. The retail gasoline price average was $1.85/gal. Retailers could still make some 73cts on the gallon.
Looking at certain areas in the Midwest and the Rocky Mountains in mid-April, rack prices for E10 gasoline (gasoline with 10% ethanol in it) fell into the teens in some locations. So, there was clearly room for money to be made.
But what about blends of fuel with more than 10% ethanol?
Let’s start with an important distinction: as cheap as ethanol got in the middle of April, it didn’t get as cheap as gasoline did. The price of corn, ethanol’s feedstock, kept prices from falling too far. For the first time in three years, ethanol held a price premium to gasoline.
Higher blends of ethanol-infused gasoline – like E30 and E85 – have a pretty big market in the Midwest and California. But, with the price inversion between gasoline and ethanol, they appeared priced out of the market.
“Those higher blends of ethanol were really starting to take off last year,” said Godwin. “And now just as they are building up some momentum, you have the coronavirus. … If this relationship is sustained for a prolonged period, you really can’t expect retailers and consumers to necessarily flock to these higher blends of ethanol.”
If Ethanol Is an Alcohol, Is It Finding Another Market These Days?
It’s 5 o’clock somewhere … No, not that kind of use!
Godwin noted that a handful of the approximately 200 U.S. ethanol producers have switched gears to being able to provide a medical-grade, pure ethanol that you can use as hand sanitizer.
But, that’s only a handful. And Godwin was quick to point out that even in the current climate, there’s no way hand-sanitizer use could hold a candle to fuel demand.
“And also, I should add, a lot of those producers have been donating that supply,” he added. “So, it’s been kind of a nice story in this chaos.”
Never miss an episode of the OPIS Crash Course podcast.Click here to get episodes pushed to your phone. It’s easy and free.