
What Is California’s Crude CI Deficit & How Does It Affect Fuel Prices?
California this year added a new layer of compliance costs under its Low Carbon Fuel Standard (LCFS) program, forcing so-called obligated parties – refiners and fuel suppliers – to scramble to adapt.
The state upped the compliance ante after it found that the average carbon intensity (CI) of crude oil used in California rose in 2018.
That left obligated parties scrambling for a benchmark for what those new requirements would add to the price of gasoline and diesel in California.
California’s Incremental Crude CI Deficit: A Brief History
In late 2019, the California Air Resources Board (CARB) alerted stakeholders that carbon in the crude oil used by state refineries over the previous three years exceeded a baseline carbon intensity (CI) for the first time in the history of the LCFS program.
Simply put, CARB found that the crude used in California refineries was too dirty.
To get into the nitty gritty, CARB determines the annual crude CI score using a rolling three-year
average. The 2018 increase pushed that CI number to 12.14 gCO2e/MJ, above the 11.91 gCO2e/MJ baseline by 0.23 gCO2e/MJ.
So, beginning on Jan. 1, 2020, CARB imposed a penalty for the poor crude CI scores, raising the
compliance target obligated parties had to meet this year to make up the difference. This is referred to as the “CI deficit.”
Remember, the LCFS program administered by CARB is designed to force obligated parties – like
refiners, fuel importers and wholesalers – to provide gasoline and diesel fuel that complies with CI targets. CI targets become stricter each year.
But Can You Put a Price on the CI Deficit?
Staring down the new targets, obligated parties had no pricing mechanism to determine the daily cost of the incremental crude CI deficit – and no way show the cost the penalty would add to the price of each gallon of gasoline and diesel sold in California based on the assessed price of LCFS compliance credits.
After conversations with a number of obligated parties, OPIS began assessing just that in its Carbon Market Report.
Looking at the June 1, 2023, Carbon Market Report below, you’ll see that OPIS assessed the LCFS credit price at an average of $85.0000/MT. That meant the incremental crude CI deficit raised the cost of gasoline by 1.1175cts/gal and the diesel by 1.2570cts/gal.
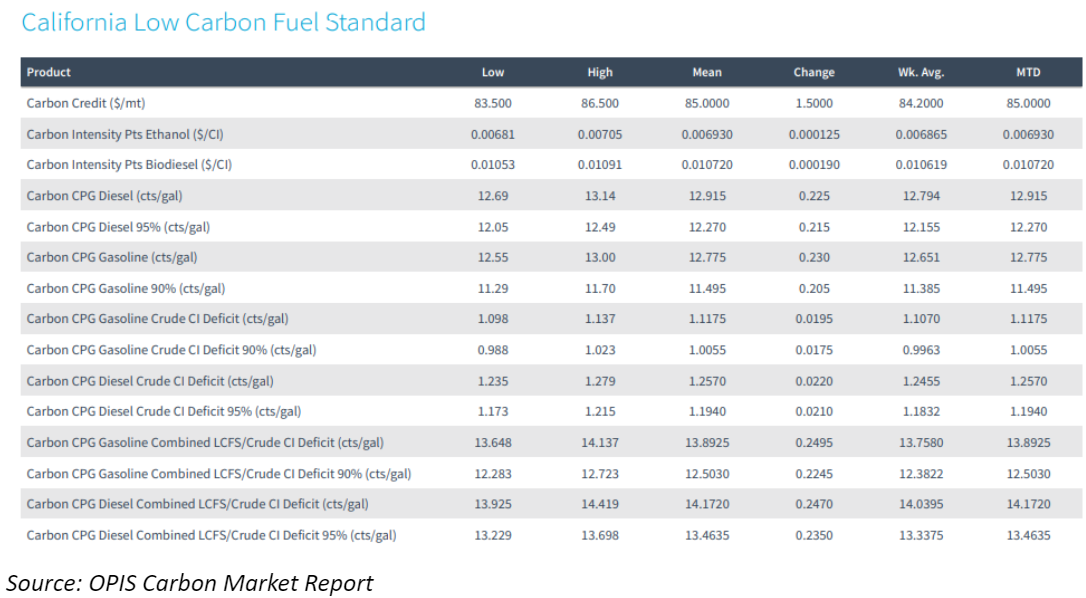
OPIS assessments also break out the cost of the crude deficit for a 90% gasoline or 95% diesel blend and assess calculated numbers combining the compliance cost of the larger LCFS program and the incremental crude CI deficit for 90% gasoline and 95% diesel blends.
So, What’s the Cost Ceiling for the CI Deficit?
The LCFS program has a cap on credit prices, which is $200 in 2016 dollars, and it requires that this price be adjusted by a Consumer Price Index (CPI) deflator in all years subsequent to 2016.
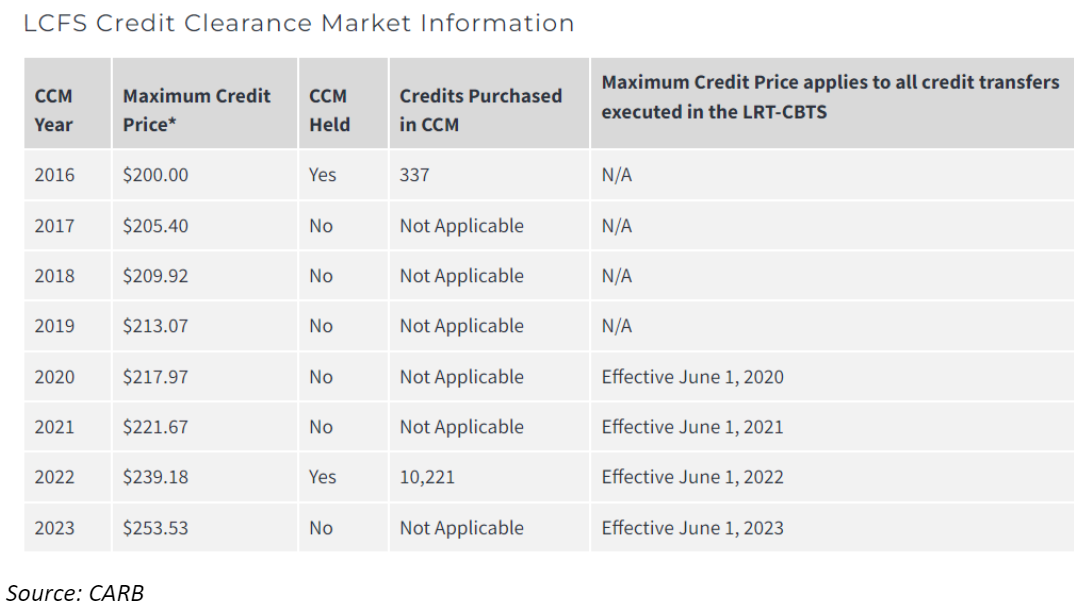
Should LCFS prices hit the 2023 maximum of $2153.53/credit, then the combined compliance cost per gallon of gasoline (including the gasoline crude CI deficit of around 0.6ct) would be about 38.09cts/gal. For diesel, it would be about 38.525cts/gal.
These maximum figures could rise in coming years as CI targets become more stringent and the
maximum credit price continues to increase with inflation.
The crude average CI went from 12.52 gCO2e/MJ in 2019 to 13.39 gCO2e/MJ in 2020 to 12.80 gCO2e/MJ in 2021, exceeding the baseline CI each year.
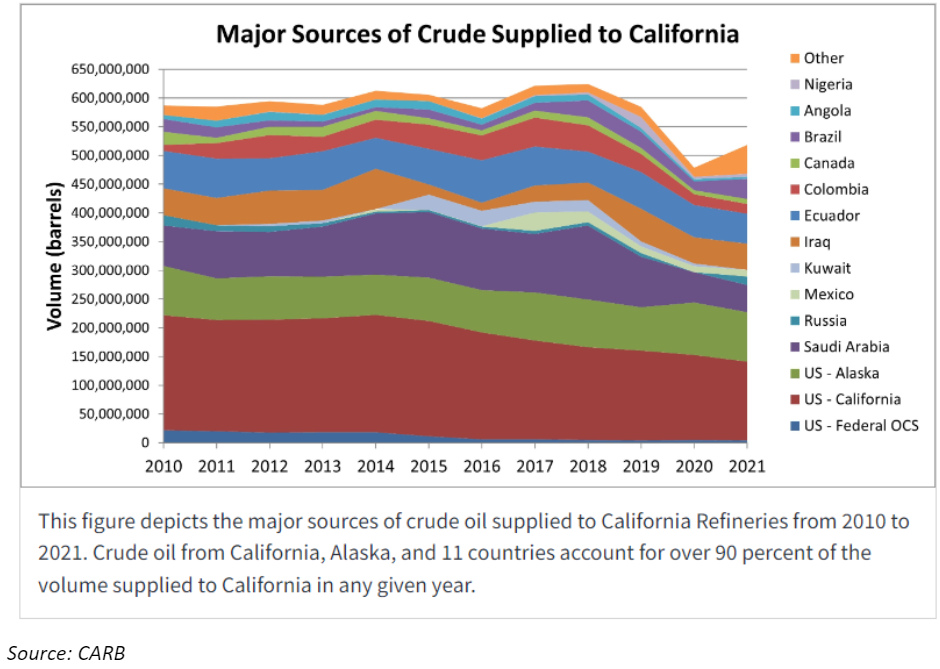
California Crude Has Seen Small Improvements in its Carbon Intensity
California’s in-state crude typically carries a higher CI score than oil imported into the state, and the state’s refiners struggled to make much improvement in the first few years following the introduction of the crude CI deficit.
LCFS and CI: How It All Works
Since its 2011 implementation and 2015 readoption, the LCFS has served as a blueprint for regional and national governments seeking to establish programs designed to curb the impact of transportation fuels on greenhouse gas emissions.
The LCFS ultimately seeks to achieve a percentage reduction in the CI of California’s transportation fuels by certain dates, targets that California has updated and modified since the program’s inception. In 2023, obligated stakeholders must achieve a 11.25% reduction.
For fuel produced or imported, a CI score is calculated using a model developed for California that considers the entire life cycle of processes involved in making, shipping and storing that fuel.
For fuels under the CI target for that year, the owner of that fuel accrues credits in the LCFS. For fuels over the CI target, the owner has an obligation that can be met by buying credits.
The cost of California’s LCFS credits climbed to record highs in early 2020, but have since retreated after CARB implemented a price cap, done in part to prevent credits from spiraling out of control.
So, How Does This Translate into Fuel Prices?
Let’s look at the June 1 report again (scroll up or open it in another window).
In the June 1 Carbon Market Report, you’ll find the LCFS Carbon Credit assessment at the top. This assessment range of $83.500-$86.500/credit, with a $85.000/credit full-day average, was based on the reporting of market activity from a range of industry sources.
From there, OPIS provides the expected CI points for ethanol and biodiesel. On this particular day, each CI point of ethanol could be expected to be worth 0.693ct, meaning, an ethanol plant with a CI score of 60 could expect to see a premium of about 6.93cts for its fuel over an ethanol plant with a CI score of 70. The biodiesel CI point was calculated at 1.072cts.
Beneath those CI calculations, OPIS offers a range of various calculations for the carbon credit values of gasoline and diesel.
Learn more in our Renewable Fuels methodology under “OPIS’s California LCFS Carbon Intensity Calculations.”
Some refiners and suppliers treat these costs differently than others, but many rely on OPIS calculations in the Carbon Market Report to help make pricing decisions.