
Analysis: Gasoline Deflation at Hand as Volatile 2023 Looms
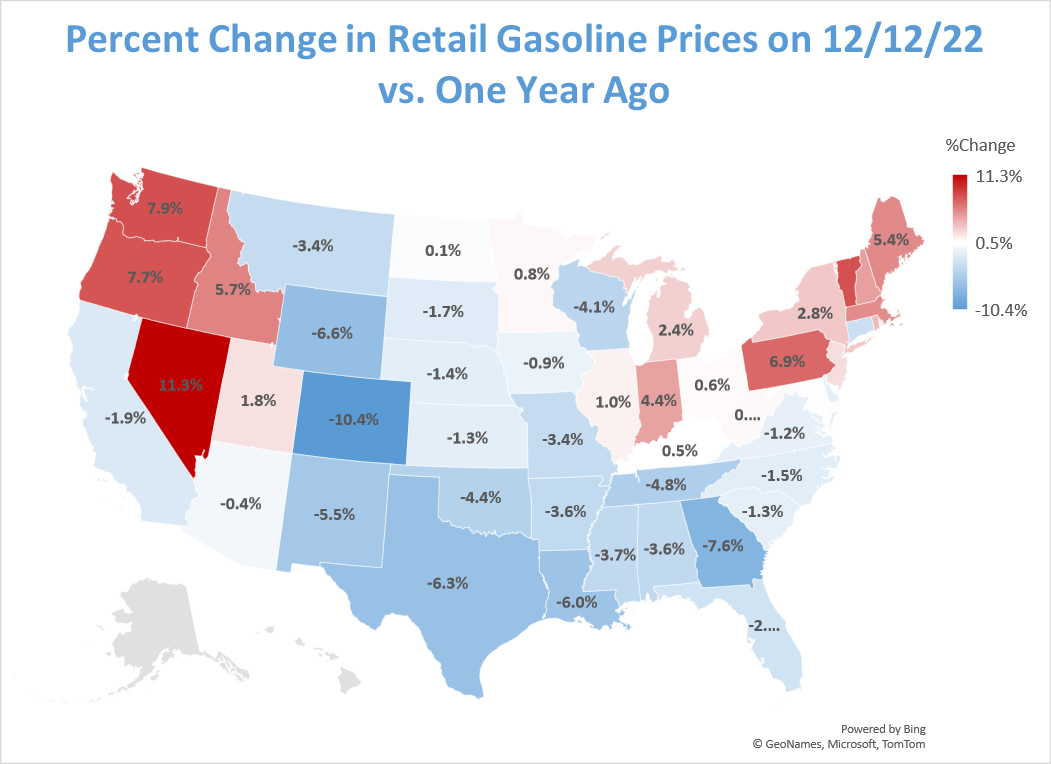
The US national average for gasoline as measured by OPIS on Dec. 12, 2022, represented deflation of 2.02% versus the same day 2021. It’s the fourth consecutive deflationary day after a span of 654 days where gasoline was more expensive than year ago levels.
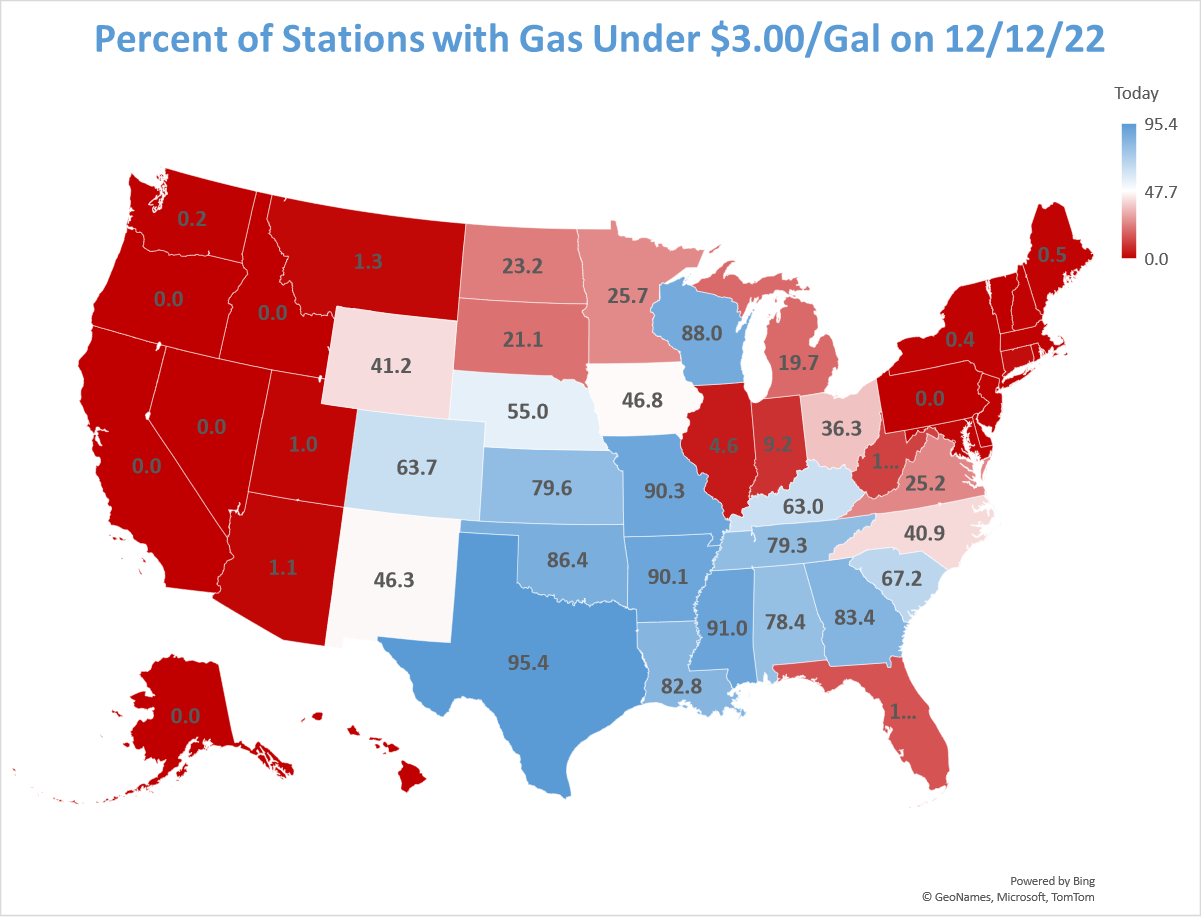
Today’s national average price of $3.262/gal represents the lowest price of 2022 but lower numbers are likely for the foreseeable 2022 future. One has to go back to October 8, 2021, to find a cheaper average US gasoline price.
 Of course, the final box score for 2022 gasoline prices won’t be available until New Year’s Day 2023. But OPIS analyzed over six billion data points in our extensive historical database and rendered observations, some of which make 2022 unique, but others that fall in line with previous years this century.
Some of the numbers lead to counterintuitive discoveries.
Example: Most marketers might think that 2022 will deliver a national average well above $4/gal, since the memory of a $5.015/gal national average is fresh. But unless there is a dramatic trend shift over the last 23 days, the country will fall several cents short of a $4/gal average. A $3.25/gal average for the rest of the year would result in an annual average just shy of $3.97/gal, and wholesale numbers point to further erosion from today’s $3.262/gal national number.
The final number will indeed still set a record for any year, without an adjustment for inflation. One can make a strong case that the 2012 annual average of $3.6035/gal counts as a more expensive year when adjusted for disposable income.
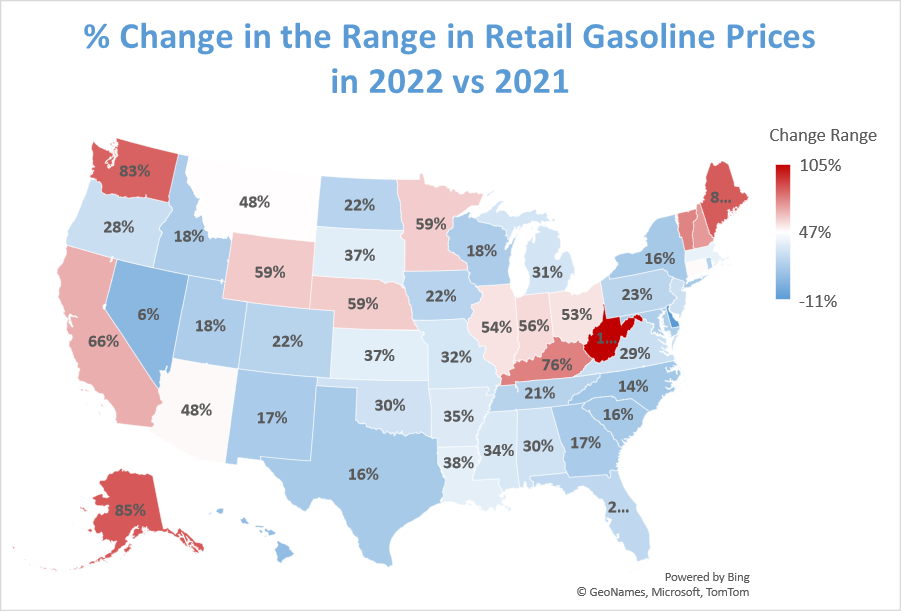 The last days of 2022 will also probably determine the amplitude of this year’s volatile retail picture. No one can contest the high, which occurred on June 14 when the national average hit $5.015/gal. But the early 2022 low of $3.2864/gal on January 1, 2022, was eclipsed over the weekend and pump prices may well flirt with $3.15/gal by year’s end. A final reading of $3.15/gal would amount to $1.865/gal separating the low and high extremes.
In comparison to the wild 2022, the early part of the millennium saw relatively tame pricing.
In 2000, gas prices hit an annual low of $1.2871/gal on January 14, and reached their zenith on June 22 at $1.6672/gal. The range of less than 39cts/gal pales when compared to some of the monthly moves in 2022. In May 2022 alone, retail prices surged by over 44cts/gal.
Some other observations on an historical day:
- Gasoline inflation in 2022 peaked on June 14 at the aforementioned $5.015/gal price. That number was $1.94/gal above the same day in 2021, an increase of 63.02%. By Election Day, gasoline price inflation eased to 11.36%.
 Surprisingly, the record for year-on-year inflation occurred in 2021. Incredibly cheap prices in the COVID year of 2020 set the stage for a 64% year-on-year rise on May 4, 2021. Americans paid $2.93/gal which compared with just $1.79/gal in 2020.
- When COVID comparisons are eliminated, some of the greatest price inflation occurred in 2011 when the Arab Spring triggered a spike in crude prices around the world. Summer national gas averages were commonly 35-37% higher than the previous year and the June 2 price point of $3.79/gal reflected a 39.99% increase.
- Notwithstanding the likely $1.865/gal that will separate the lows and highs this year, the 2008 year saw even greater variation. Prices ended that year at levels at $1.617/gal, nearly $2.50/gal below the $4.1144/gal apex seen in mid-July.
- California looks likely to record an annual price in excess of $5.50/gal (the year-to-date number is $5.558/gal). The current Golden State average of $4.62/gal compares with the high-water mark of $6.4375/gal on June 14. That price stands as the highest average ever recorded for any state at any time.
- The two most deflationary years in contemporary times for US gasoline prices are 2009 and 2015. The Great Recession delivered a 2009 retail average of just $2.3481/gal, a drop of 28% from the $3.2512/gal average for 2008. An abysmal OPEC failed meeting in November 2014 set the stage for a 2015 gasoline price average of just $2.399/gal, reflecting a drop of 28.2%. The COVID year of 2020 registered an average price of $2.1786/gal, a drop of “only” 16.5%.
- In order for 2023 to top the deflationary impact of these years, gas prices would need to average $2.87/gal or less next year. That performance is possible but not probable in the view of most analysts.
- Premium gasoline inflation is much more severe than price pressure on regular gas. On average, high-octane blends fetched 69.77cts/gal over regular this year. That compares with less than 15cts/gal in 2000.
- The annual lows occur an inordinate number of times in December or January. Twenty-three years of history find the low tide mark for gasoline occurring ten times in the first calendar month, with December the next most likely month for a bottom at six occurrences.

Currently, it’s difficult to look forward and not expect gasoline deflation to continue for the first few quarters of 2023.
Sloppy gasoline markets look almost certain for next month, and February will see the one-year anniversary of the Russian invasion of Ukraine.
Monthly average prices for gasoline earlier in 2022 add up to numbers of $3.3171/gal in January; $3.4968/gal in February; $4.1688/gal in March; and $4.1305/gal in April. Those months are followed by $4.4586/gal; $4.921/gal and $4.5483/gal levels for May, June, and July.
Unless there is a drastic recovery in crude prices or gasoline, deflation looks likely to have a minimum seven-month grip on the country. A June 2023 price average of $3.54/gal, for example, would amount to a 28% year-on-year decline and match the performance in the deflationary years of 2009 and 2015.
Grade your retail fuel station profit performance against key competitors in any market. Get an exclusive look at margins over time for competing brands and price leaders with OPIS MarginPro.