
Natural Gas Prices in 2019: A Regional Outlook
U.S. natural gas prices could very well be looking at a volatile year in 2019.
While U.S. dry gas production is soaring, natural gas demand is also growing, most notably as a global fuel source with exports to Mexico and through liquefaction terminals on the Gulf Coast and East Coast consuming more and more gas each month.
What do these developments mean for natural gas supply, demand, storage and price?
Several important developments emerged in 2018. First, natural gas dry production in the Lower 48 repeatedly set new records on a daily, weekly and monthly basis. In every month but December, production levels set a new record, usually by a wide margin. This allowed the U.S. to build its position as the world’s top producer of natural gas.
Second, from a demand perspective, fuel switching in the electric power sector was less affected by price than in prior years. During summer 2018, natural gas prices remained above the levels that traditionally had incentivized power generators to switch to coal operations. But the switching didn’t occur last year, and gas demand remained strong even at higher price levels. In short, gas-generated power has become more inelastic as it relates to competing fuels, particularly coal.
Third, higher and steady prices in summer 2018 affected the pace of injections of natural gas into storage during the summer. End-of-summer inventory levels were 13% below the five-year average and their lowest since 2002. As fall began, however, those low inventories led to another effect: increased volatility.
Top Natural Gas Price Trends in 2019
As we look to 2019, OPIS PointLogic has several key questions we will be asking:
- Will the recent gas price volatility continue into 2019?
- Will inventories remain below the five-year average?
- Will nat gas demand eclipse 2018’s records – and can supply keep up?
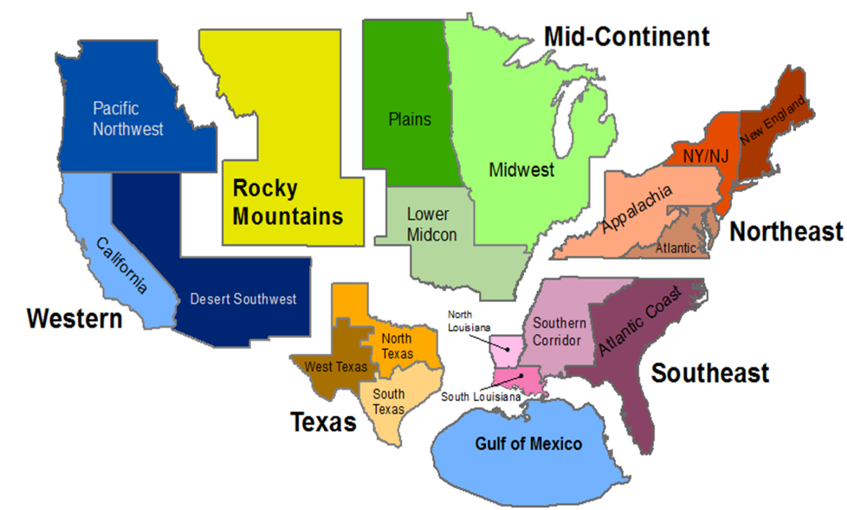
These are important issues to watch on a national and regional basis. For price volatility, OPIS PointLogic will be watching both Henry Hub and the regional markets, which are affected differently by the forces driving the natural gas industry. The Northeast and West Texas are now the centers of production in the Lower 48, with the Southeast and Midcontinent largely relegated as demand centers. The Rocky Mountains are facing mounting pressure on production without much systemic demand growth, while the Western market’s view on natural gas dependency looks tenuous at best.
Below are some key issues that our regional analysts will be following this year.
Northeast Natural Gas Market Matures in 2019
After years of rapid infrastructure buildout and record production, the Northeast will have a year of maturing into its new realities in 2019. Pipeline projects through year-end 2018 outpaced production growth, but this year the story will be production rising to take full advantage of that new infrastructure.
Major pipeline completion activity will slow considerably. In 2019, there are only two projects on track for in-service that can directly draw upon Appalachian gas production: Empire North Expansion (0.2 Bcf/d) and Mountain Valley Pipeline (2.0 Bcf/d), and there’s a fear that MVP could be delayed into 2020.
This is a far cry from 2018, during which 7.0 Bcf/d of new takeaway capacity went into service. Because Northeast production only grew by 4.1 Bcf/d in 2018, the region has reached a point of production being less constrained by pipeline takeaway capacity. In 2019, we will be watching to see how pipeline utilization rates rise in response to that available capacity. OPIS PointLogic is forecasting production to increase by another 4.1 Bcf/d in 2019, and about half of that growth was evident even as 2018 came to a close.
Also, our outlook is for added natural gas price volatility as pipeline utilization rates rise and Northeast production becomes tied to the realities of physical LNG exports both from Cove Point LNG in Maryland and the major liquefaction centers in the Southeast and Texas.
Midcontinent Uptick in Nat Gas Pipeline Projects & Production Capacity
During 2018, the Midcontinent was increasingly thrust into the role of diverting gas supplies towards higher-value markets, a trend brought on by infrastructure projects that laid the foundation for the part it will play in the 2019 gas market.
Two major projects came last year, the Rover Pipeline and NEXUS Pipeline. They not only allowed Appalachia gas to supply Midwest markets, but also represented new competition to supply the Dawn Hub north of the U.S.-Canada border in Ontario. These new dynamics created an increase in southbound capacity on existing pipes, diverting gas towards the only logical market – the Gulf Coast.
Meanwhile on the production side, drillers in the SCOOP and STACK plays in Oklahoma’s Anadarko Basin are poised to realize more of the productive capacity of the plays in 2019, as nearly 2.0 Bcf/d of gas takeaway capacity is expected to come online over the course of the year. The vast majority of these takeaway projects are aiming to deliver the incremental gas output from the SCOOP/STACK at – you guessed it – the Gulf Coast, based on the expectation of strong increases in LNG export demand in 2019.
Southeast/Gulf Gas Demand Keeps Growing in 2019
In 2019, the Southeast and Gulf will be all about the opportunities created by new demand.
The Southeast is forecast to add 1.6 Bcf/d of new annualized demand in 2019, its largest increase since 2016 when Sabine Pass LNG exports began and gas-fired power generation skyrocketed on a hot summer and cheap gas prices. The fifth train at Sabine Pass LNG and the in-service of Cameron LNG and Elba Island as export facilitates could create up to 2.2 Bcf/d of incremental feed gas demand.
On the production side, the Haynesville had a banner year in 2018, growing by 1.4 Bcf/d. In 2019, we expect Haynesville to remain flat as production growth from lower-cost alternatives in the Permian and Northeast take over.
Adding up those supply and demand factors, we expect more price volatility in the region and an increase in the value of salt storage within the region. Gas stored in salt caverns can be moved to market more quickly than gas stored in other underground facilities – making it ideal for market participants who are seeking to temper some of those price ups and downs with additional storage fills during times of low prices.
Here’s one final regional factor to watch. Southeast power demand is forecast to surpass the records set in 2016, based on normal weather forecasts. A hot summer, coupled with incremental LNG demand and potentially low storage levels, could be the catalyst needed to upend any expectations of cheap gas prices.
Texas Gas Export Demand Heats Up in 2019
Texas export demand is really set to heat up in 2019. Freeport LNG and Train 2 at Corpus Christi LNG are each expected to come online by the third quarter of the year, and they will add up to 1.3 Bcf/d of potential feed gas demand. Exports to Mexico are forecast to increase by 0.4 Bcf/d in 2019, setting a new record. As a result, total exports from Texas are forecast to account for 25% of the state’s production, up from 20% just two years ago.
The lack of takeaway capacity from the Permian will be resolved by the fourth quarter of 2019, when up to 5 Bcf/d of new projects are on track to reach service. Permian production is poised to quickly utilize any new takeaway capacity.
Also, price disparities within Texas in 2018 will continue into 2019, due to the constraints of takeaway capacity. This volatility will create headaches for some and opportunities for others.
Rockies/West Challenged by Oversupply & Market Competition
The Rocky Mountain region is oversupplied with gas and has challenges in finding outlets for gas that’s produced in the Denver-Julesburg, Green River and other basins.
Competition is coming from every direction. From the East, we see Northeast producers pushing their way into what was traditionally a Rockies market. This is forcing Rockies supply to shift to the West. But pipeline constraints to the Southwest continue to play an important role in dictating how much Rockies gas will find a home in the West.
At the same time, producers face rising supplies of competing gas being produced in the Permian Basin – gas that’s steeply discounted as producers view it, to some extent, as a byproduct of their oil production. This low-priced gas influences basis differentials all the way to Southern California.
Meanwhile, gas competition also comes from Canada, as abundant, low-priced supplies move south through the West Coast states and into the large California market.
On the demand side, increased use of grid-scale solar power generation in California continues to displace electricity imports and continues to limit California’s power-sector gas demand.
The positive signal to watch is increased U.S. gas exports to Mexico; this market has the potential to pull gas from the Southwest before it reaches California. The pipelines have been built on the U.S. side of the U.S.-Mexico border, but Mexico’s pipeline infrastructure is lagging behind. Will 2019 be the year when that infrastructure is in place and will it add a new dimension to market options in the Southwest?
Stay ready
Stay informed about each of these trends and get valuable forecasts of supply and demand at each region’s hubs through OPIS PointLogic comprehensive weekly regional reports. These reports are available to PointLogic subscribers through our Trend Alert service and will be added to the PointLogic Suite over the course of the year.