
Memorial Day Gasoline Review: America Didn’t Crank Up Its Engines
Correct or not, Memorial Day is often the time we take the temperature of gasoline demand. How did 2020 stack up?
Markets are colored by dynamic differences of opinion, but Memorial Day 2020 came and went with more than the usual division in attitudes about economic recovery and what – in some years – can be a proxy for economic recovery: gasoline consumption.
There’s no debating the song of demand destruction that first became audible in March hit a noisy crescendo around Easter Weekend and mixed in some belated rhythm with the COVID-19 blues in late May.
Some of the mileposts are stunning. Data collected by OPIS from more than 15,000 unique fueling stations across the country hinted that Easter Sunday April 12 may have been the lowest day for U.S. gasoline consumption since January 1962, when The Tokens’ Lion Sleeps Tonight topped the music charts.
A week later the market still looked dreary, as this image shows:
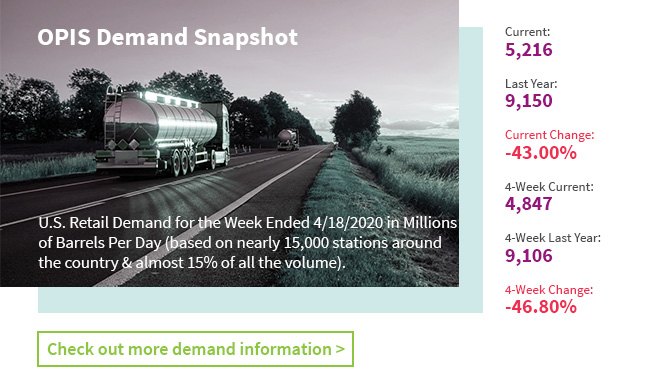 To get this demand snapshot weekly, make sure you are subscribed to the free OPIS Weekly Update.
The entire month of April 2020 won’t be archived by the Energy Information Administration (EIA) for another 35 days, but OPIS sentinels suggest a demand number of about 5-million b/d for domestic gasoline demand is appropriate. For historical context, a dip to that level would represent the lowest U.S. monthly consumption since March 1968.
The best estimates for gasoline consumption in the days leading up to and after Memorial Day suggest a stateside demand number of about 7-million b/d. One has to go back to the third year of the Reagan Administration to find a similar level and the population has swelled by some 94-million people since that 1983 milepost.
Forecasts Vary for Summer 2020 Driving Season
What is striking as we move through what is mythically known as “the driving season” is just how divided analysts and industry participants are by the prospects.
Since the April nadir, refiners and bullish futures’ traders have trumpeted the slow, but steady, rise in gasoline demand that has followed. At its peak, demand destruction was just above 50%, thanks to shelter-in-place orders, closed commercial buildings, the abrupt end of spring sports and the suspension of mass assembly. OPIS measured mid-May demand at about 71.1% of the year-ago level, which would indicate an outright number just shy of 7-million b/d.
When it comes to the divergent analysis for the summer ahead, a famous anonymous quote comes to mind: “He uses statistics like a drunken man uses a lamp post; not for illumination, but for support.”
Some have championed Apple Mobility data. Some recent manifestations of that data, which measures requests for map assistance for those using iPhones, have declared that searches have returned to pre-COVID-19 levels. An unfortunate circumstance to this baseline, however, is that it corresponds to mid-January, when fuel demand is always depressed and road trips are anathema to many travelers.
Other high-tech methods attempt to gauge road congestion as a primary indicator of fuel consumption. Having grown up in the most congestive corridor of the country – northern New Jersey – it’s odd to see investors and economists rooting for a return of the gridlock that often made 2019 urban and suburban travel quite miserable.
Detractors of fossil fuels, or bearish directional traders, have their own crutches to grasp. Bears dismiss the notion of pent-up demand, road trips replacing shorter flights and health-conscious individuals eschewing mass transit for the safety of slow travel in their own light vehicles.
But What Do We Think?
With all of the viewpoints and measuring tools in mind, it’s hard to conceive of a driving season that comes anywhere close to what Americans experienced in the last four years, or for that matter in the 21st century.
We’ll take the liberty of condensing the gasoline season into the premier driving months of June, July, and August (All three have represented yearly peaks most of the time).
There will be no driving to concerts this summer; no long queues to get into vast parking lots for baseball, football or soccer. Road trips may be inhibited by the lack of confidence in hotel room sanitation.
And there will be far less commuting. Scores of companies have closed hundreds of offices. Far more important than Apple Mobility may be the adaptation of Zoom, Microsoft Teams, GoToMeeting or Cisco Webex.
And finally, one can utilize Occam’s Razor and predict with relative certainty that vehicle miles traveled and gallons used will resemble 20th century levels in the months ahead.
June will begin with about 40-million people unemployed in the United States. Gasoline prices of $1.50/gal to $1.99/gal aren’t seductive to those without jobs or paychecks and road trips don’t have allure for people with no money for lodging or amusement.
So, from now through Labor Day, I suspect we’ll see mobility that evokes the 1990s. If you’re wondering what the range of gasoline consumption was in that decade for the summer months of June, July, and August, the low was 7.38-million b/d and the high was 8.94-million b/d.
A good over/under bet in Vegas, if it restarts this summer, would ask whether one of the next three summer months eventually hits 9-million b/d in the record books. I’m betting we’ll see the occasional rogue (high) week, but no month will measure that high.
There is another problem in polishing demand numbers in the next three months and heralding the demise of COVID-19 impacts. The 2020 numbers will be matched up to some of the spectacular demand “comps” from the 2019 driving season.
Whether one believes a recent 6.7-million b/d EIA estimate of U.S. demand or the 6.1-million b/d that OPIS gathers from station sales, there are huge distances between current levels and 2019 driving season numbers.
The first week of June 2019 saw EIA measure gasoline demand at 9.871-million b/d, and there were 11 times between that milepost and end-September that produced weekly estimates above 9.5-million b/d. On two unprecedented occasions, U.S. weekly gasoline demand last summer exceeded 9.9-million b/d, a level never previously witnessed.
Many market watchers believe the best the U.S. market could hope for in 2020 might be to claw back all but 10-15% of the demand destruction inspired by COVID-19. That would still result in deficits to last year that occasionally flirt with 1.5-million b/d. There are some extraordinary fears related to autumn consumption if there is indeed a second wave of coronavirus.
 Is Memorial Day a Gasoline Demand Myth Anyway?
A short but notable footnote: Memorial Day is no more the official starting gate for summer travel than April 1 is, and April Fool’s Day is actually the first bracket in EIA’s definition of driving season. The finish line is September 30.
Beyond the dispute one can tie to the calendar and the rotation of the earth on its axis, there’s the matter of whether the Memorial Day holiday inspires any real noticeable uptick in demand.
The myth of a Memorial Day consumption spike can be documented by comparing the week preceding the Friday of the holiday weekend and that week itself. The myth is that consumers fill their tanks ahead of the high-traffic weekend.
Data suggest otherwise. In 2016, there was a slight boost, with implied demand rising by 200,000 b/d or just over 2%, when measuring statistics on “Getaway Friday.” In 2017, the same week brought an increase of just 118,000 b/d or a negligible 1.2%. In 2018, both of the last two weeks of May were identically measured at 9.689-million b/d. And last year gasoline demand actually declined from 9.429-million b/d to 9.394-million b/d.
Read about how gasoline retailers faired in Q1 2020 in this free OPIS report. You’ll get in-depth commentary and insightful charts and graphs of major data points.